 tellnova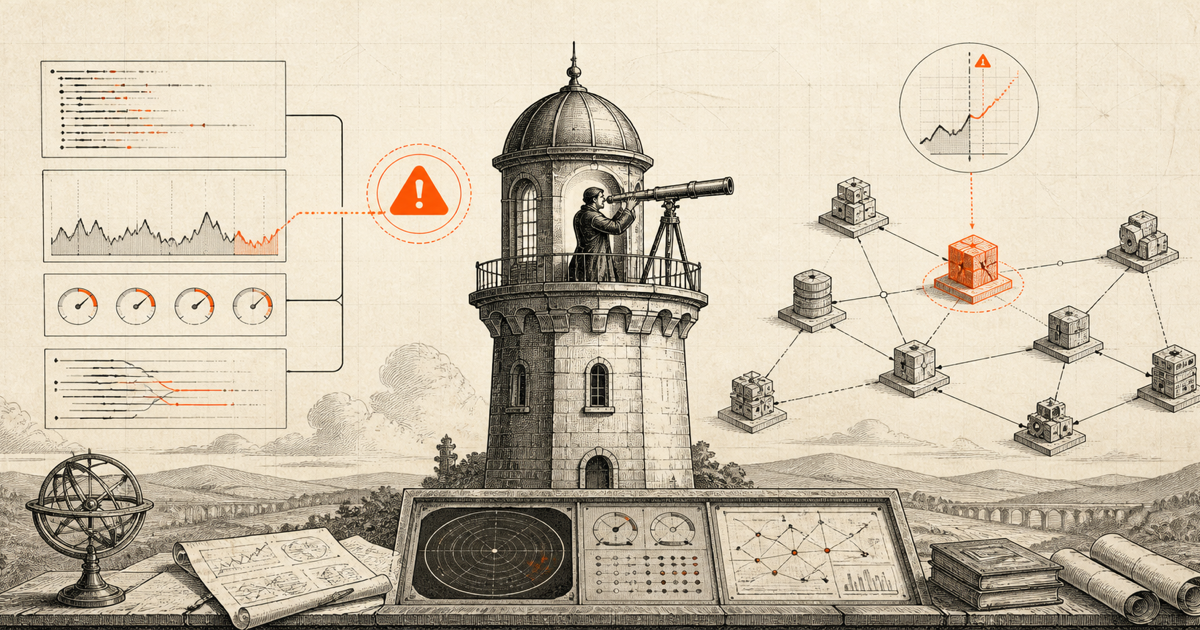
An effective observability setup tells you that a system is drifting toward failure while there is still time to act. It combines telemetry with service objectives and alerts that have an owner. The goal is not to collect every possible event. The goal is to answer, quickly: what is failing, who is affected, why it changed, and what should happen next?
Monitoring checks conditions you already know to ask about. Observability lets you investigate conditions you did not predict. You need both. A dashboard can show a red line after customers are already blocked; a useful reliability system also watches the leading signals that usually arrive first.
What observability actually means
Observability is the ability to understand a system's internal state from the data it emits. That data usually has three pillars:
- Metrics summarize behavior over time: request rate, error rate, latency, queue depth, CPU, memory, and database connections.
- Logs explain discrete events with context: a failed checkout, a rejected token, or a worker retry.
- Traces follow one request across services and show where time or failure accumulated.
These signals become much more useful when they share the same service name, environment, release version, request ID, and trace ID. Without that common context, teams have three separate search tools instead of one explanation.
Observability does not promise that every outage can be predicted. It improves the odds by combining customer-impact alerts with leading indicators such as saturation, queue growth, retry storms, certificate expiry, dependency errors, and unusual deployment behavior.
Start with user journeys and service objectives
Do not begin by installing an agent on every machine. Begin with the experiences that must work. For a software product, those might be sign-in, creating a task, processing a payment, or completing a background job.
Give each critical journey a service-level indicator, or SLI. Common examples are successful requests divided by total requests, or the percentage of requests completed below a latency threshold. Then set a service-level objective, or SLO, such as 99.9% successful sign-ins over 30 days.
The difference between the target and perfect reliability is the error budget. Alerts based on how quickly that budget is being consumed are more useful than a generic alert saying CPU crossed 80%. A fast burn means users are being harmed now. A slow burn means the trend will violate the objective if it continues.
For a concise introduction to this model, read Google's SRE guidance on service-level objectives.
Instrument once with OpenTelemetry
OpenTelemetry is a vendor-neutral standard for producing and exporting metrics, logs, and traces. It keeps instrumentation in your application independent from the backend where you inspect the data.
A practical first deployment looks like this:
- Add the OpenTelemetry SDK or automatic instrumentation to each service.
- Set consistent resource attributes: service name, environment, region, and release version.
- Send OTLP data to an OpenTelemetry Collector rather than directly to several vendors.
- Use the Collector to batch, redact, sample, and route telemetry.
- Export to the storage and visualization stack you already operate.
A minimal Collector pipeline can receive OTLP, batch the data, and export it to your chosen backend:
receivers:
  otlp:
    protocols:
      grpc: {}
      http: {}

processors:
  batch: {}
  memory_limiter:
    check_interval: 1s
    limit_mib: 512

exporters:
  otlphttp/observability_backend:
    endpoint: https://your-observability-backend.example/v1/otlp

service:
  pipelines:
    traces:
      receivers: [otlp]
      processors: [memory_limiter, batch]
      exporters: [otlphttp/observability_backend]
    metrics:
      receivers: [otlp]
      processors: [memory_limiter, batch]
      exporters: [otlphttp/observability_backend]
Keep secrets out of this file. Inject endpoints and credentials through environment variables or a secrets manager. Tellnova's environment-variable guide covers the same separation for agent projects.
Collect signals that predict customer pain
For every production service, start with the four golden signals: latency, traffic, errors, and saturation. Then add the signals specific to its failure modes.
- API: success rate, p50/p95/p99 latency, request volume, rate-limit rejections, and dependency failures.
- Database: pool utilization, slow queries, replication lag, lock waits, storage growth, and connection errors.
- Queue or worker: oldest message age, queue depth, completion rate, retry rate, dead letters, and worker availability.
- Host or container: CPU throttling, memory pressure, disk capacity, file descriptors, restarts, and network errors.
- Business journey: successful sign-ins, completed checkouts, created tasks, or processed jobs.
Business-journey signals are essential. Infrastructure can look healthy while every checkout fails because of an application or provider error.
Control telemetry cost at the source. Keep all low-cardinality service metrics, sample routine successful traces, retain errors and unusually slow traces, and never use unbounded values such as user IDs as metric labels. Logs and traces can still carry carefully redacted request-level context.
Alert on symptoms and leading indicators
Use two layers of alerts. The first catches customer impact through SLO burn rate, elevated error rate, or severe latency. The second catches conditions likely to become customer impact: a filling disk, an expiring certificate, a growing queue, exhausted connection pools, or replicas falling behind.
Every page should answer four questions:
- What user-visible outcome is at risk?
- Which service and environment triggered the alert?
- Who owns the response?
- Which dashboard and runbook should they open?
Route urgent, actionable pages to an on-call channel such as PagerDuty, Opsgenie, or a dedicated incident destination. Send non-urgent capacity and trend warnings to a ticket queue. If nobody should act immediately, it should not wake somebody up.
A useful alert description is concrete: "Checkout success is consuming the 30-day error budget 14 times faster than allowed in production." A weak description says only: "Error threshold exceeded."
Protect the alert path itself. Send a scheduled heartbeat through the telemetry pipeline and notify through a separate channel if it disappears. Otherwise the monitoring system can fail silently before the service does.
Connect every alert to a runbook
A runbook turns detection into recovery. Keep it short enough to use under pressure. Include the dashboard link, recent deployments, dependency status, safe diagnostic commands, rollback procedure, escalation owner, and a clear way to confirm recovery.
Automation can help with the first safe steps: attach recent deploys, collect relevant traces, summarize correlated errors, or open an incident channel. Tellnova automations can run repeatable agent tasks in the background, but production changes should still respect permissions, approvals, and rollback boundaries.
Do not let an agent invent a remediation during an outage and execute it with unrestricted access. Encode known-safe actions, keep credentials scoped, and require human approval for destructive or high-impact changes.
Test the observability setup before trusting it
An untested alert is a hypothesis. Verify the full route in staging and production with controlled failure exercises:
- return a known test error and confirm it appears in metrics, logs, and traces;
- introduce bounded latency and confirm the SLO burn-rate alert fires;
- stop a test worker and watch queue age trigger the correct warning;
- verify the notification reaches the intended on-call destination;
- open the runbook from the alert and confirm its commands still work;
- resolve the condition and confirm the alert closes automatically.
Run these checks after major telemetry changes and on a schedule. Review noisy alerts, missed incidents, and alerts that arrived after a customer report. Delete alerts that do not lead to action; add coverage where real incidents exposed a blind spot.
A small production-ready rollout
Ship observability in testable slices. In week one, instrument one critical user journey end to end and establish its SLI, SLO, dashboard, and owner. In week two, add burn-rate paging plus a few high-confidence leading indicators. In week three, connect runbooks and test the notification path. Then repeat the pattern service by service.
The result is not a wall of charts. It is a feedback system: shared telemetry explains behavior, SLOs define unacceptable impact, alerts create timely ownership, and runbooks shorten recovery. That is how observability gives a team a chance to intervene before a weakening system becomes an outage.